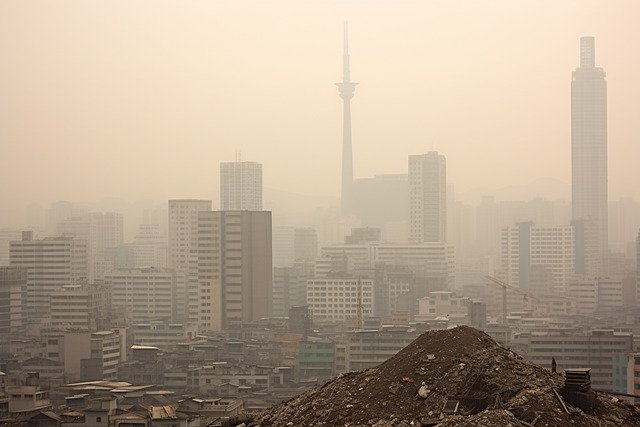
Cities are epicenters of humanity’s energy use, transportation, industry, and consumption—and thus they are major sources of carbon dioxide emissions. Understanding the carbon footprint of urban areas is crucial not only for climate accounting, but also for guiding mitigation strategies at the scale where people live and act.
However, estimating the emissions of cities is not straightforward. Traditional “bottom‐up” inventories often rely on energy consumption data, emission factors, and local statistics, but they can suffer from uncertainties, outdated parameters, and spatial aggregation that mask local heterogeneity.
A recently published study used satellite observations to derive a “top-down” estimate of CO₂ emissions from 54 cities worldwide. Their findings largely corroborate conventional inventories (within about 7 %), yet they reveal intriguing regional discrepancies. This method offers an independent check, increases transparency, and could help refine urban climate strategies. Advance+3Wiley Online Library+3Servidores de Informes Técnicos de NASA+3


In the following sections, we review the scientific approach, key findings, and implications—and then explore how such insights might (or might not yet) apply in the Costa Rican context.
Background Concepts
2.1 What Is the Urban Carbon Footprint?
The “urban carbon footprint” refers to the total CO₂ (and often other greenhouse gas) emissions attributable to activities within a city’s boundaries or functional area. This includes energy use (electricity, heating, cooling), transportation, industrial processes, and often upstream emissions (e.g. from goods and services consumed within the city). It differs from national or global footprints by focusing on the spatial scale of cities, which are the locus of much of humanity’s emissions.
Urban footprints are critical for climate mitigation because cities have leverage over transport, building codes, waste management, and energy systems. Knowing where emissions concentrate within a city helps target interventions.
2.2 Traditional (Bottom-Up) Estimation Methods
Most urban emission inventories adopt a bottom-up approach: they gather data on fuel consumption, electricity use, transport activity, industrial outputs, etc., then multiply by emission factors to get CO₂ emissions. This method benefits from having local detail and control over assumptions, but it has limitations:
- Emission factors may be outdated or generic, not reflecting local technology or efficiency.
- Some sources (like fugitive emissions, distributed combustion, or small local generators) may be underreported.
- Spatial resolution is coarse; one cannot always see intra-city differences.
- The method depends on reliable local data, which many cities lack.
Thus, bottom-up estimates can have substantial uncertainties, especially when comparing across regions or when local data is weak.
2.3 The Top-Down Alternative: Atmospheric & Satellite Observations
A complementary method is top-down estimation, which uses atmospheric measurements of CO₂ (and related gases) to infer surface emissions. In the context of cities, satellites like OCO-3 (Orbiting Carbon Observatory-3) can measure column-averaged CO₂ concentrations.
The logic is: if we know how CO₂ is distributed in the atmosphere above a city (minus background), and we model the air flows (winds, mixing, dispersion), then we can invert this information to estimate how much CO₂ must have been emitted below (the “flux”). In practice, these estimates are refined using additional constraints (e.g. NO₂ observations as a co-emitted tracer, meteorological models) to separate anthropogenic sources from background and to correct for transport.
In the studied 54 cities, researchers used OCO-3 satellite CO₂ data, paired with TROPOMI NO₂ measurements (to temporally collocate and cross-check anthropogenic activity) and atmospheric trajectory models (e.g. HYSPLIT) to derive city-level emissions via a method called Cross-Sectional Flux (CSF). Media Relations+3Wiley Online Library+3Servidores de Informes Técnicos de NASA+3
This top-down approach provides an independent “reality check” on bottom-up inventories, and can reveal spatial and temporal patterns that are otherwise hidden.


The Satellite Study of 54 Global Cities
3.1 Overview of the Research
The new study, published in AGU Advances in 2025 by a multinational team of atmospheric scientists, represents one of the most comprehensive attempts to measure urban CO₂ emissions directly from space. Using data from NASA’s OCO-3 (Orbiting Carbon Observatory-3) and the European TROPOMI sensor aboard the Sentinel-5 Precursor satellite, the researchers analyzed 54 major cities across six continents between 2019 and 2023.
Their method combined CO₂ column observations with nitrogen-dioxide (NO₂) plumes—an excellent tracer for fossil-fuel combustion—to isolate anthropogenic emissions. They applied a “Cross-Sectional Flux (CSF)” technique, which integrates the CO₂ concentration along the path of the prevailing wind over each city. The resulting “flux” reflects how much CO₂ is being added to the atmosphere as the air mass passes across the urban area.
The team compared these top-down satellite-derived emissions with existing “bottom-up” inventories such as EDGAR v7 and ODIAC. The differences were typically within ± 7 %, which indicates remarkable consistency given the entirely independent methods. However, some regions—particularly parts of Africa and South Asia—showed significant underestimation in their inventories, suggesting data gaps or incorrect emission factors.
3.2 The Global Picture
Together, the 54 cities emitted an estimated 1.73 billion tons of CO₂ per year, roughly 18 % of total global urban emissions. The largest contributors were sprawling metropolitan regions in East Asia, North America, and Europe—though the exact rankings depend on how one defines city boundaries.
A key takeaway is that urban emissions correlate more strongly with economic structure than with population size alone. Cities heavily dependent on manufacturing or coal-based power had far higher fluxes per unit of GDP than service-oriented economies.

3.3 Methodological Significance
This research is groundbreaking because it demonstrates independent verification of city-level carbon accounting. As more satellites with high-resolution spectrometers are launched—such as Japan’s GOSAT-G and NASA’s GeoCarb—such measurements may become routine.
This opens the possibility of real-time transparency in emission monitoring, similar to how weather satellites track storms.
For developing regions, including Latin America, the method is especially valuable because it provides standardized measurements without depending on inconsistent local statistics. This could help countries like Costa Rica, which has strong environmental commitments but limited dense monitoring networks, to validate their low-carbon transition with empirical evidence.
Key Findings and Global Patterns
4.1 Emissions and Economic Output
The study revealed striking inequalities in carbon intensity per unit of economic activity.
- In North American cities, each U.S. dollar of economic output corresponds to roughly 0.1 kg of CO₂ emitted.
- In African cities, the ratio is around 0.5 kg CO₂ per USD, reflecting lower energy efficiency and heavier reliance on fossil fuels.
- Asian industrial hubs often fall in between, depending on their energy mix.
This means that wealthier cities tend to be more carbon-efficient, although they may still have large absolute emissions.
4.2 Population Size and Efficiency
Another notable trend: as city size increases, per-capita emissions drop dramatically.
- Small-to-medium cities (< 5 million inhabitants) average 7.7 tons CO₂ per person per year,
- while megacities (> 20 million inhabitants) average only 1.8 tons.
The likely explanation is the “urban efficiency effect”—dense urban forms reduce transport distances, enable mass transit, and concentrate infrastructure.
4.3 Regional Discrepancies
Satellite data exposed several hotspots of underreported emissions, particularly in emerging industrial corridors. In contrast, cities with rigorous environmental accounting (e.g., Paris, Los Angeles, Tokyo) showed strong agreement between satellite and inventory data.
This emphasizes that transparency and accurate local data remain crucial: the satellite view helps, but cities must still provide detailed ground information.
4.4 Implications for Latin America and Costa Rica
Latin America was underrepresented in the study—only a few cities like São Paulo, Mexico City, and Buenos Aires were analyzed—but their data reveal an intermediate emission intensity: less than Asian industrial centers yet higher than European ones.
For Costa Rica, no city was directly included, but the country’s small urban footprint and high renewable-energy share (over 98 % electricity from renewables) suggest its urban emissions are significantly below global averages.
Nevertheless, the Greater Metropolitan Area (GAM)—which includes San José, Heredia, Alajuela, and Cartago—faces rising challenges from transportation emissions and urban sprawl. Integrating satellite-based CO₂ monitoring could provide Costa Rica with transparent metrics to support its carbon-neutrality goals for 2050 and demonstrate climate leadership in Central America.
Implications and Uses of Satellite-Based Data
5.1 A New Era of Transparency
The ability to measure CO₂ directly from space marks the beginning of a new age for climate accountability. Until recently, most cities had to rely on self-reported data, often years out of date. With satellites like OCO-3, TROPOMI, and upcoming missions such as GeoCarb, governments, researchers, and citizens can now see near-real-time estimates of emissions over urban landscapes.
This transparency can transform how cities plan and communicate their climate progress. Instead of publishing inventories every few years, local authorities could verify mitigation actions seasonally or even monthly. It is a step toward what some scientists call “climate governance by observation.”
5.2 Supporting Local Climate Policy
For municipal planners, such high-resolution information has several applications:
- Urban zoning and transport: Data can reveal CO₂ hotspots tied to congested traffic corridors or industrial areas, guiding low-emission zoning or public transport expansion.
- Infrastructure investment: It helps evaluate whether energy-efficiency programs or green-building policies are working.
- Verification of pledges: Many cities have joined initiatives like the C40 Cities Climate Leadership Group or the Global Covenant of Mayors. Satellite data offers an independent audit mechanism for their carbon-neutrality commitments.
In Costa Rica, where most electricity already comes from renewables, the next frontier lies in decarbonizing mobility and logistics. Satellite-based monitoring could help track emissions from transport corridors linking San José to coastal ports—information that is currently estimated but not directly observed.
5.3 A Tool for Developing Regions
For the Global South, where data quality often limits emission inventories, satellites provide standardized, comparable information. A single orbital pass can generate measurements equivalent to thousands of ground sensors.
In Central America, adopting such techniques could:
- Fill data gaps for cities like San José, Alajuela, or Liberia.
- Strengthen regional climate negotiations by supplying independent evidence.
- Empower local universities and environmental agencies to collaborate with international space missions.
Costa Rica’s experience as a carbon-neutral pioneer makes it a perfect candidate for pilot projects that demonstrate how small nations can use global science for national benefit.
Toward a Costa Rican and Latin American Perspective
6.1 Current Status of Urban Emissions in Costa Rica
Costa Rica’s total CO₂ footprint is low by global standards—about 1.2 tons per person, compared with the world average of 4.5 tons. Yet most of these emissions come from transportation, concentrated in the Greater Metropolitan Area (GAM). Rapid urban growth, increasing car ownership, and long daily commutes have made mobility the Achilles’ heel of the country’s decarbonization plan.
Current inventories rely on national energy statistics and fuel import data. Integrating satellite observations could offer a spatially explicit view of where emissions arise within the GAM, allowing better-targeted public-transport and electrification policies.
6.2 Lessons from Latin American Cities
Cities such as Mexico City, Bogotá, and Santiago have begun experimenting with urban air-quality satellites and emission-model integration. These initiatives show that when satellite data are combined with ground sensors, they can pinpoint local pollution sources and verify emission reductions from public-transport reforms or renewable transitions.
Costa Rica could learn from these examples by establishing partnerships with Latin American universities and agencies participating in NASA’s SERVIR Program, which already provides remote-sensing support in the region.
6.3 A Vision for the Future
Imagine a “Central American Carbon Atlas” updated monthly from satellite data—where citizens, policymakers, and companies can visualize their region’s evolving carbon footprint. Costa Rica, with its reputation for environmental leadership, could host such an initiative, becoming the first Central American hub for urban carbon monitoring.
This would align perfectly with the country’s National Decarbonization Plan 2018–2050, which calls for scientific transparency, data-driven decision-making, and international collaboration.
6.4 Why It Matters for Biodiversity and Conservation
Beyond urban policy, understanding carbon flows has direct relevance for Costa Rica’s ecosystems. The same satellites that measure CO₂ over cities can detect carbon sinks over forests, mangroves, and wetlands. Linking these datasets would reveal how well the country’s protected areas compensate for urban emissions, and could support conservation financing or carbon-credit verification through verifiable science.
In essence, the technology that watches our cities breathe can also show how our forests exhale life back into the atmosphere—a poetic and practical bridge between urban climate action and biodiversity protection.
Challenges, Critiques, and the Future of Satellite Urban Monitoring
7.1 The Challenge of Atmospheric Complexity
While satellite-based CO₂ measurement offers a revolutionary window into urban emissions, it is not without technical challenges. The atmosphere is dynamic: winds shift, air masses mix, and weather patterns can obscure the true source of a signal. Translating concentration data into emission rates requires sophisticated atmospheric transport models and careful calibration.
Cloud cover, aerosols, and local topography (like Costa Rica’s mountain valleys) can all affect satellite readings. For tropical regions, persistent cloudiness can limit the number of usable observations. Therefore, researchers must combine satellite data with ground-based sensors and numerical simulations to refine accuracy.
7.2 Calibration and Validation Needs
Reliable “ground truth” remains essential. In Europe, the United States, and Japan, extensive networks of in situ CO₂ sensors help validate satellite measurements. Latin America, by contrast, still lacks dense observational coverage. Establishing regional calibration stations—for example, near San José or Liberia—would make the data far more useful for local decision-making.
International cooperation will be key. NASA, the European Space Agency (ESA), and Japan’s JAXA have all expressed interest in expanding ground validation networks in the tropics. Costa Rica’s strong academic and environmental institutions make it a natural partner for such initiatives.
7.3 The Resolution Dilemma
Satellites like OCO-3 can detect variations of a few kilometers, but for complex, medium-sized cities, this may still be coarse. Urban “micro-emissions”—such as neighborhood-level traffic, waste management, or small industries—often fall below the current resolution limit. Future missions (e.g., CO2M, GeoCarb) promise finer detail and higher frequency, enabling hourly monitoring of urban fluxes.
7.4 Data Accessibility and Policy Uptake
Another challenge is ensuring that this information is accessible, interpretable, and actionable for policymakers. Raw satellite data can be highly technical. The next step is to develop visual platforms—interactive maps and dashboards—that translate scientific data into policy tools.
For Costa Rica, embedding such platforms within institutions like MINAE, SINAC, or the National Meteorological Institute could bridge science and governance, ensuring that satellite insights feed directly into transportation, urban planning, and conservation policy.
Seeing the Invisible
The study of 54 global cities represents a milestone in climate science: for the first time, we can see carbon as it moves through the air above our cities, transforming abstract numbers into tangible spatial patterns. It reveals both humanity’s collective footprint and the promise of new tools to manage it.
8.1 Global Takeaways
- Cities matter: Urban areas account for over 70 % of anthropogenic CO₂ emissions.
- Science is catching up: Satellite technology can now independently verify what cities emit.
- Efficiency is uneven: Wealthier, denser cities emit less CO₂ per capita, while growing industrial centers still struggle to decouple growth from emissions.
These insights can guide more equitable and transparent global climate policies.
8.2 Costa Rica’s Opportunity
Costa Rica’s unique position—small, biodiverse, and powered largely by renewable energy—makes it a living laboratory for integrating climate observation and conservation. While its total emissions are modest, its urban areas could serve as case studies in sustainable mobility and carbon neutrality.
By adopting satellite monitoring early, Costa Rica could:
- Validate its national carbon-neutrality claims with independent evidence.
- Develop educational programs that merge space science, ecology, and urban planning.
- Inspire neighboring countries to pursue similar approaches, strengthening the region’s scientific sovereignty.
8.3 A Closing Thought
In a time when global headlines are dominated by conflict and environmental crises, this kind of research reminds us that knowledge is power—and that technology can help us see our impact with new clarity. From the bustling streets of San José to the rainforests of Corcovado, every ton of carbon tells a story about how we live, move, and coexist with nature.
If Costa Rica embraces these new “eyes in the sky,” it could not only measure its emissions—it could also show the world how a small nation can lead with science, sustainability, and sincerity.